 "Urambo Tauro" (urambotauro)
10/04/2018 at 18:00 • Filed to: safety, statistics, nhtsa, crashes, fatalities
 3
3
 8
8|
"Urambo Tauro" (urambotauro)
10/04/2018 at 18:00 • Filed to: safety, statistics, nhtsa, crashes, fatalities | 3
| 8 |
!!! UNKNOWN CONTENT TYPE !!!
The NHTSA !!!error: Indecipherable SUB-paragraph formatting!!! its yearly overview on traffic crashes, but there’s been a twist since I studied these documents a couple of years ago.
The annual “[year] Motor Vehicle Crashes: Overview” document has been renamed “[year] Fatal Motor Vehicle Crashes: Overview”. And it’s not just the title that’s different.
As the name change suggests, the most recent documents ( !!!error: Indecipherable SUB-paragraph formatting!!! and !!!error: Indecipherable SUB-paragraph formatting!!! , released in 2017 and 2018, respectively) leave out information regarding overall crash statistics. Such info was included in 2015 & earlier reports, but now they focus only on crashes that actually resulted in fatalities.
Two years ago, I was looking at the 2015 report, which stated that fatalities had reached 35,092, a 7.2% increase over 2014’s 32,744. But those numbers failed to reflect just how bad drivers had become in the US, as the report also noted that overall crashes (fatal and non-fatal) jumped from 6.064 million to 6.296 million (and that’s only counting police-reported incidents).
!!! UNKNOWN CONTENT TYPE !!!
The 2016 and 2017 Motor Vehicle Crashes: Overview reports have gone and left out all information regarding non-fatal crashes, explaining that a new system had been adopted, rendering injury and property–damage-only crash information unavailable at time of publication. This supposedly had something to do with the “newly modernized” Crash Report Sampling System (CRSS) replacing the National Automotive Sampling System (NASS) General Estimates System (GES).
2016’s overall crash statistics remained unavailable until just last month, when the NHTSA finally released a !!!error: Indecipherable SUB-paragraph formatting!!! for 2016. In this summary, we can finally see 2016’s non-fatal crash figures, and the results are staggering.
Or they would be, if not for a disclaimer noting that “A direct comparison of the 2016 injury, and property-damage-only crash estimates cannot be made with any previous year.” Funny that they saw fit to ignore this and throw 2016’s stats together in a table with previous years anyway:
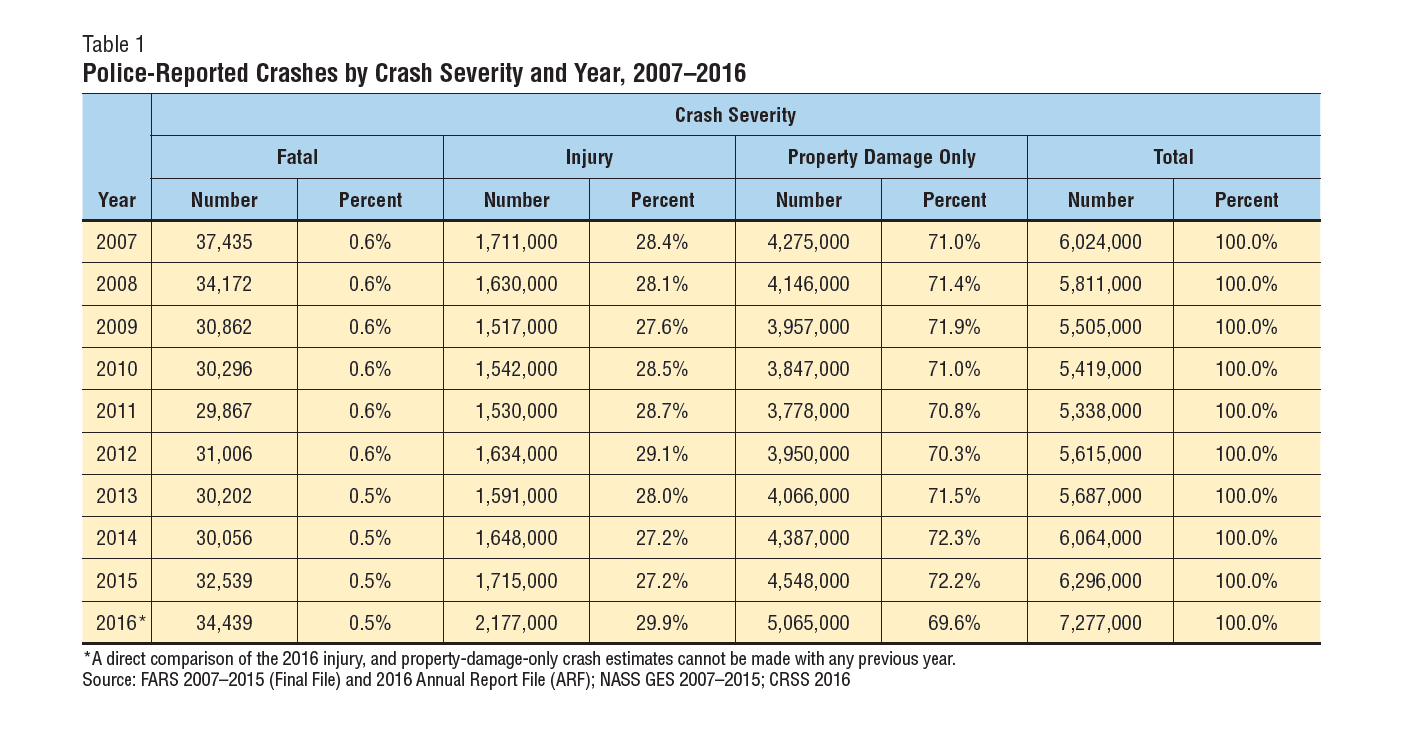
So let’s go ahead and take those figures with a grain of salt while we make a direct comparison anyway.
Comparing 2016 to 2015, it shows “only” a 5.8% increase in fatalities. However, this table also shows a 15.5% increase in overall crashes. This includes a 11.3% increase in property damage, and a whopping 26.9% increase in injuries. The Vehicle Miles Traveled (VMT) figures don’t even come close to explaining those away.
VMT rose 1.2% in 2016. But even though we did more driving compared to 2015, crashes increased at an alarmingly disproportionate rate. One can only hope that there’s something wrong with the statistics that would warrant that disclaimer about making direct comparisons.
So what about 2017? Well, we’re still waiting on the rest of that info. We do know that fatalities dropped slightly (a mere 1.8% from 37,461 to 37,133), and VMT went up another 1.2%, from 3.213 trillion miles in 2016, to approximately 3.25 trillion.
So fewer people have died in traffic-related incidents, as we’ve been driving more. But does that mean we’ve become better drivers? Probably not. If anything, it’s likely a testament to advances in the safety technology that we’re allowing ourselves to become so increasingly dependent on.
 MM54
> Urambo Tauro
MM54
> Urambo Tauro
10/04/2018 at 18:11 |
|
AKA Cars are getting safer and making people who don’t know how to drive more comfortable in their ineptitude. Instead of getting better (or dying in a crash) they complacently text away and figure their car will hit the brakes for them, and if not they’ll be uninjured.
 NKato
> Urambo Tauro
NKato
> Urambo Tauro
10/04/2018 at 18:15 |
|
And this is why I prefer to drive cars that are closer to analog than one that has been stuffed with digital nannies.
 facw
> NKato
facw
> NKato
10/04/2018 at 18:28 |
|
The digital nanny cars are safer though, even if the drivers are worse.
 Chariotoflove
> MM54
Chariotoflove
> MM54
10/04/2018 at 18:31 |
|
Or put another way, safety is becoming less dependent on driver skill. Does that mean driver skill is going down overall? Don’t know.
 TheRealBicycleBuck
> Urambo Tauro
TheRealBicycleBuck
> Urambo Tauro
10/04/2018 at 18:58 |
|
Don’t forget to account for the number of new drivers. I think its somewhere around 4 million new drivers added to the total population of drivers between those years. Given that the birth rate is at or below replacement rate, how many of the new drivers are adult immigrants who learned to drive sthrough me where else?
 wafflesnfalafel
> Urambo Tauro
wafflesnfalafel
> Urambo Tauro
10/04/2018 at 22:23 |
|
T ell me about it - my job is to pay for all of those. We initially honestly thought nanny electronics would help - turns out it just makes repairing a vehicle nearly three times as expensive.
 winterlegacy, here 'till the end
> Chariotoflove
winterlegacy, here 'till the end
> Chariotoflove
10/05/2018 at 00:44 |
|
Correlation does not always equate causation, but I’d say it’s safe to say that in this case, it equates.
I don’t know how many times I’ve been cut off by brand spanking new pickup trucks...
 Long_Voyager, Now With More Caravanny Goodness
> Urambo Tauro
Long_Voyager, Now With More Caravanny Goodness
> Urambo Tauro
10/05/2018 at 06:19 |
|
Idk, there were almost 1,000,000 more crashes total.
I’d say cars are just better at saving ( stupid ) people.